Total costs and footprint for the five percent recycle scenario would include requirements for both high-rate treatment and equalization. However, the residuals produced from these three high-rate processes are expected to be >3 percent solids, and consequently should not require additional thickening prior to dewatering. Although costs for SFBW treatment using “conventional” gravity settling, including plates or tubes, are not included in Table B.2, since these processes do produce residuals with about 0.3 percent solids, these processes would require additional thickening to achieve one percent solids or greater prior to dewatering. Consequently, since the high-rate SFBW treatment options produce so much higher percent solids in the residuals stream, installation of these processes would also avoid the thickening costs required for other processes if residuals are to be sent for dewatering. Other high-rate processes, for example sand ballasted coagulation or upflow buoyant media clarification, may not produce percent solids as high as the three processes evaluated at Morgan, and consequently costs for thickening should be included when comparing these processes to the above processes.
These results demonstrate that a ClariDAF system with two 5,200 gpm treatment trains designed at 14 gpm/ft2 nominal (i.e., manufacturer) clarification rate and requiring a minimum of 16 minutes flocculation would require an area of 4,900 ft2 within the western portion of the residuals handling building currently housing the SFBW clarifiers. The estimated footprint includes area for all required flocculation, clarification, chemical feed, air saturation, and other assorted appurtenances. Therefore, though nominally a 14 gpm/ft2 system when you consider only clarification area, when you consider the entire footprint impact (including the 100 percent redundancy assumption) the rate expressed relative to the new total treatment area when one train is out of service is 5,200 gpm for a 4,900 ft2 area, or about 1.06 gpm/ft2.
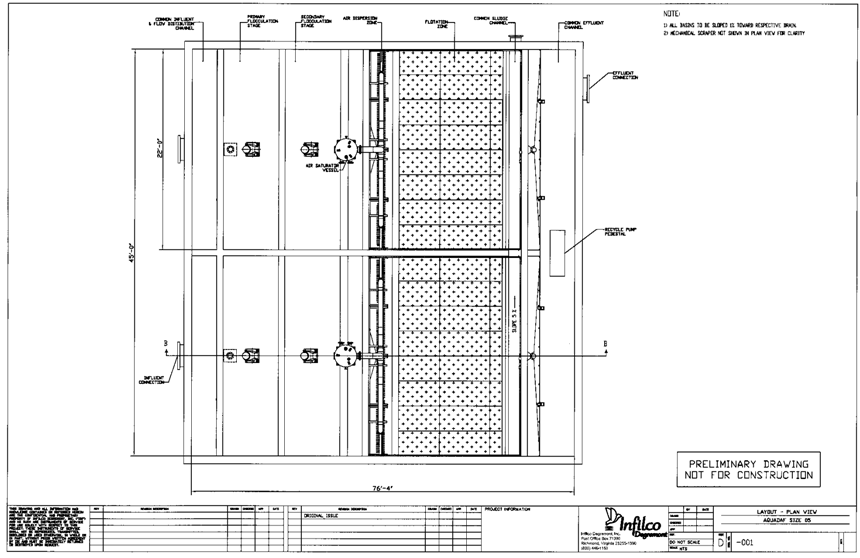
Similar evaluations for the AquaDAF process indicates that the required footprint for two 5,200 gpm treatment trains is 3,600 ft2, or 1.44 gpm/ft2 for the nominal 14 gpm/ft2 process (including 15 min flocculation) when expressed relative to total footprint impact instead of only clarification area. The DensaDeg process assumptions included two 5,100 gpm facilities in order to provide the same redundancy assumption (one train out of service), requiring about 3,300 ft2 for a nominal 10 gpm/ft2 process, or a 1.55 gpm/ft2 clarification rate expressed relative to total footprint impact (with one train out of service).
EXISTING FACILITIES
The
Morgan WTP located in
Spent filter backwash (SFBW) is treated by a clarifier and recycled to the head of the plant, while the removed solids are discharged to the sanitary sewer. The existing SFBW treatment facilities include two 350,000-gal equalization (EQ) basins, referred to as the “East” and “West” EQ basins. Both basins can pump directly to the sludge holding tank, the SFBW clarifier, or to the head of the main plant.
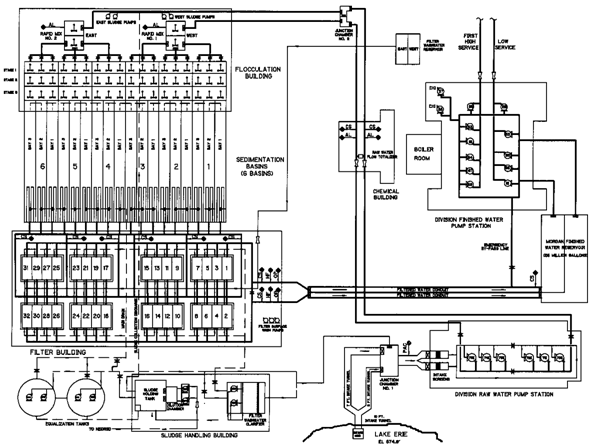
Figure B.1 Morgan WTP process
schematic
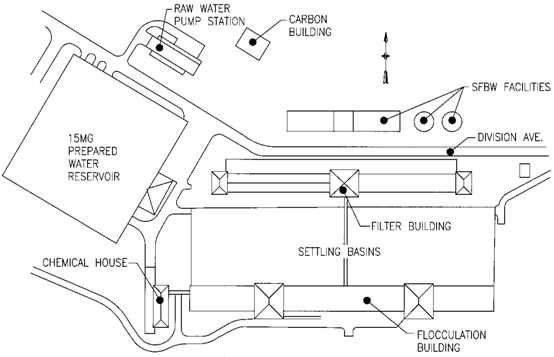
Figure B.2 Morgan WTP facilities
site plan
Analogous to Figures B.1 and B.2 depicting the entire WTP facility, Figures B.3 and B.4 depict a site plan and schematic for the SFBW treatment and handling portion of these facilities. SFBW treatment includes equalization (without mixing), a flash mix tank, three-stage flocculation, clarification, and recycle of clarified SFBW to the head of the plant. The SFBW clarifier is vacuumed by a traveling bridge sludge collection system to a 450,000-gal sludge holding tank where it is combined with sludge from the main plant’s sedimentation basins. When necessary, a sludge dilution chamber is used to dilute the sludge to a 0.4 percent solids concentration before being discharged to the sanitary sewer.
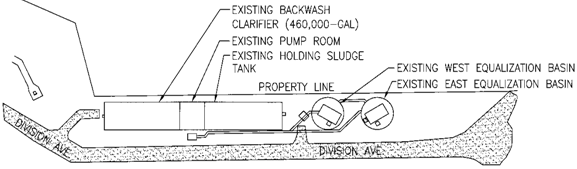
Figure B.3 Morgan WTP SFBW treatment facilities site plan
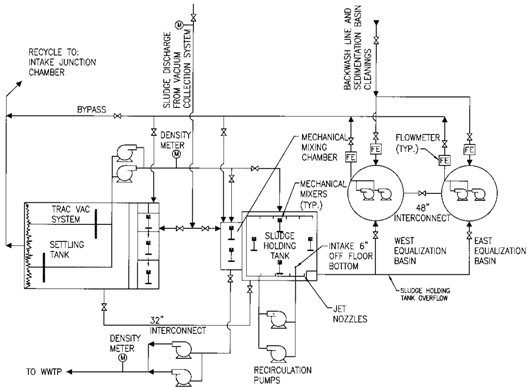
Figure B.4 Morgan WTP SFBW
treatment facilities schematic

![]()
Figure B.5 Morgan WTP SFBW full
scale clarifier testing
Full scale testing of the existing clarifier was conducted in 2000. Morgan WTP’s SFBW was typically around 20 ntu and was effectively treated to <2 ntu at loading rates up to 0.8 gpm/ft2 (Figure B.5) when polymer was applied. Without polymer addition, the treated turbidity ranged from 5 to 13 ntu at loading rates from 0.53 to 0.8 gpm/ft2 respectively. Based on these test results, a conservative maximum loading rate of 0.6 gpm/ft2 with polymer was chosen. Morgan WTP currently does not use polymer for SFBW treatment.
SFBW EQUALIZATION DESIGN
ASSUMPTIONS
Table B.3 lists backwash operation assumptions developed in consultation with CWD for the Morgan WTP. These operational assumptions were used for calculating the EQ storage volume required and were based on present and future Morgan WTP operations information.
Table B.3
Morgan WTP operational assumptions
|
Maximum filtration rate |
3 gpm/ft2 |
|
Minimum plant flow rate (5th percentile flow) |
55 mgd |
|
Maximum plant flow rate |
150 mgd |
|
Recycle rate (10 percent maximum) |
5 percent (Partnership for Safe Water) |
|
Backwash volume |
260,000 gal/backwash |
|
Backwash frequency interval |
30 min/backwash event (1st four filters) 55 min/backwash event (remaining 24 filters) |
|
Backwash duration |
10 min |
|
Maximum number of backwashes per day |
28 |
The SFBW EQ basin storage capacity required was calculated using these operational assumptions with the parameters incorporated into a 24-hr storage profile. The results for the assumption with 28 filter backwash events in a 24-hour period (four every 30 minutes in first two hours, than one filter every 55 minutes thereafter) when the Morgan WTP is producing minimum production of 55 mgd are presented in Figure B.6 for three recycle rates (three percent is upper curve, five percent middle curve, and 10 percent lowest curve – dashed line is existing EQ capacity). The curves in Figure B.7 demonstrate that even if bigger equalization basins were available and even at a recycle rate of 10 percent the plant would never be able to equalize all the SFBW within a 24-hour period (i.e., plant would have to cease all filter backwashing so EQ could be emptied).
Since it was not physically possible to operate the facility under these conditions, a different set of design assumptions were developed, in consultation with CWD. These included assuming a filtration rate of 3 gpm/ft2 (filters are currently permitted at 4.4 gpm/ft2). At this rate, nine filters would be in service when plant is producing 55 mgd, as opposed to the 28 filters assumed to develop calculations in Figure B.6. Table B.4 lists the number of filters needed at this filtration rate under different main plant production targets. Figure B.7 shows the estimated equalization volume needed under similar conditions as used in Figure B.6, except with nine filter backwash events within a 24-hour period instead of 28. At 10 percent recycle, the amount of equalization storage needed is 0.91 MG, or 0.21 MG more than the existing 0.7 MG capacity. An additional 44-ft diameter equalization basin would be required for the additional volume. At lower recycle rates, more equalization is needed. The Morgan WTP operates under Partnership for Safe Water guidelines requiring recycle rates less than five percent. Calculations reflected in Figure B.7 indicate that required equalization at this recycle rate is about 1.62 MG, or about 0.92 MG more than existing equalization. This would require one additional 93-ft diameter equalization basin. If the recycle rate under these conditions is less than five percent, the required equalization is even higher. For example, the predicted equalization storage required for three percent recycle is 1.91 MG, or about 0.3 MG more than at five percent recycle.
Therefore, in order to meet the design assumptions established during conversations with CWD (55 mgd, nine filter backwash events per day, five percent recycle), the required equalization is 1.62 MG, or requiring an additional 93 ft diameter equalization basin to supplement the two existing 0.35 MG basins. Note that this does not make any allowances for redundancy, meaning all equalization basins have to be in service to handle the design condition.
This preliminary
design report for CWD will be included in the Foundation SFBW report to be
viewed by utilities throughout the
SFBW TREATMENT DESIGN
ASSUMPTIONS
The
above discussion indicated that the design assumption for recycle, and hence
for SFBW treatment, is five percent recycle. Consequently, five percent of 150
mgd is 7 mgd, or about 5,200 gpm. For redundancy, enough treatment will be
provided so that new proposed SFBW treatment systems will be able to handle
5,200 gpm of SFBW even with one SFBW treatment train out of service.
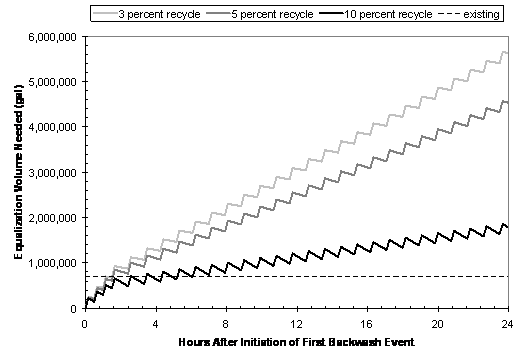
Figure B.6 Morgan WTP SFBW
production during 24-hour period assuming 55 mgd production rate, three recycle
rates (3, 5, and 10 percent), and 28 filter backwash events per day (0.26 MG
per backwash event)
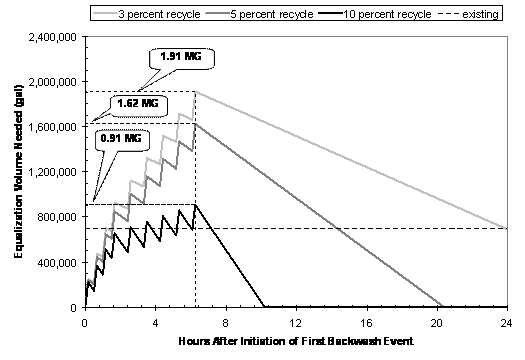
Figure B.7 Required SFBW
equalization assuming 55 mgd production rate, three recycle rates (3, 5, and 10
percent), and nine filter backwash events per day (0.26 MG per backwash event)
Table B.4
Morgan WTP filter operations
|
Plant raw water flow rate (mgd) |
Number of filters in service @3 gpm/ft2 |
Total backwash generated (mgd) |
|
55 |
9 |
2.3 |
|
65 |
11 |
2.9 |
|
75 |
12 |
3.1 |
|
85 |
14 |
3.6 |
|
95 |
16 |
4.2 |
|
105 |
17 |
4.4 |
|
115 |
19 |
4.9 |
|
120 |
19 |
4.9 |
|
125 |
20 |
5.2 |
|
135 |
22 |
5.7 |
|
145 |
23 |
6.0 |
|
150 |
24 |
6.2 |
|
|
28 |
7.3 |
RETROFIT OF MORGAN WTP’S SFBW
EQ
Current
operational conditions at the Morgan WTP require additional EQ storage volume
for the low flow condition and an increase in clarifier capacity for the high
flow condition. Considering Morgan WTP’s SFBW characteristics and the recent pilot trials
by Leopold and IDI, four alternatives were selected for a plant retrofit:
Option A: Additional EQ storage basin (common to all clarification options)
Option B: New ClariDAF system by Leopold
Option
C: New AquaDAF system by IDI
Option
D: New DensaDeg system by IDI
Option A: Additional Equalization Capacity
Option A for solving current Morgan WTP operational challenges involves the construction of a new EQ basin. The flow schematic for this option is provided in Figure B.8. A possible site for this basin is just east of the current EQ basins and is shown in Figure B.9.
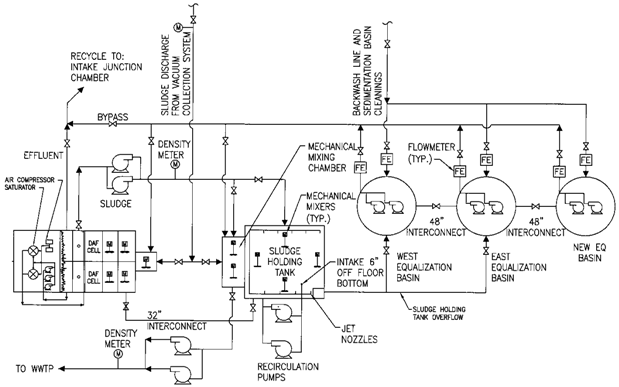
Figure B.8 Morgan SFBW schematic
with new EQ and new SFBW treatment system
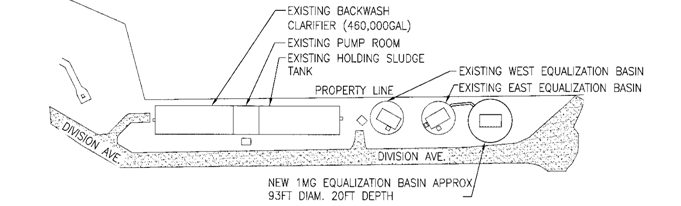
Figure B.9 Morgan WTP SFBW new EQ siteplan
Table B.5
Morgan WTP SFBW EQ cost analysis for 5 and
10 percent recycle limits
|
Item |
Capital cost ($) |
|
New 0.92 MG EQ basin (5 percent recycle) |
4,740,000 |
|
New 0.21 MG EQ basin (10 percent recycle) |
2,453,000 |
Capital cost for both a 0.92 MG and a 0.21 MG EQ basin are summarized in Table B.5. Obviously, a considerable cost savings would be attained for utilities that can consider increasing the recycle rate from 5 percent to 10 percent during the rare low flow condition. However, CWD operates the Morgan WTP under Partnership for Safe Water guidelines which limit recycle to five percent or less.
Option B: Retrofit existing clarifier with New High
Rate ClariDAF System
ClariDAF is a high rate dissolved air flotation system designed by Leopold as depicted in Figure B.10. ClariDAF can be operated at loading rates of 8 to15 gpm/ft2. Clarification rates for this system are based on flow per square foot area occupied by the effluent laterals located at the bottom of the DAF cell. A loading rate defined in this manner does not account for the increased footprint due to the remainder of the system’s components.
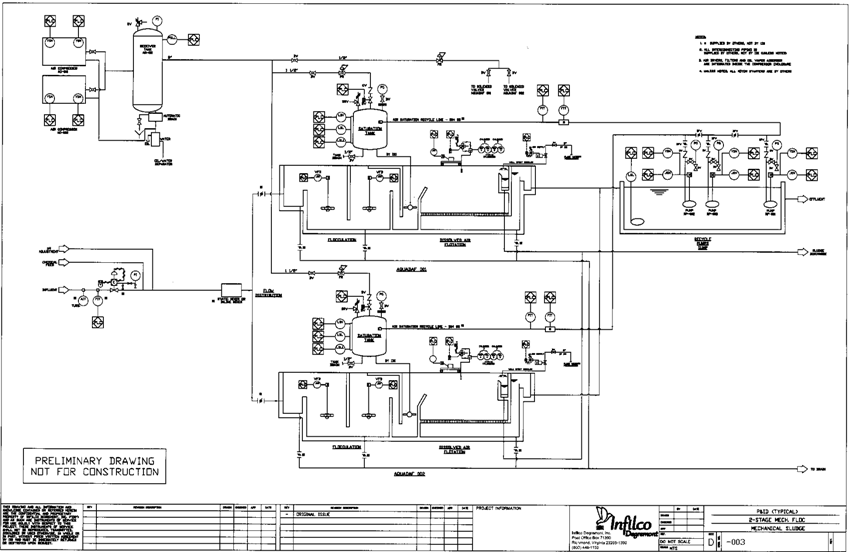
The ClariDAF system, as depicted in the schematic in Figure B.11, utilizes a rapid mix zone where polymer may be added followed by one or more flocculation basins and a DAF cell. An internal angled baffle wall create a recirculation effect throughout the DAF cell which increases bubble density and efficient flotation for removal of the “float”. The clarified water exits the system through the laterals and into an effluent channel while the float solids are mechanically skimmed into a collection channel.
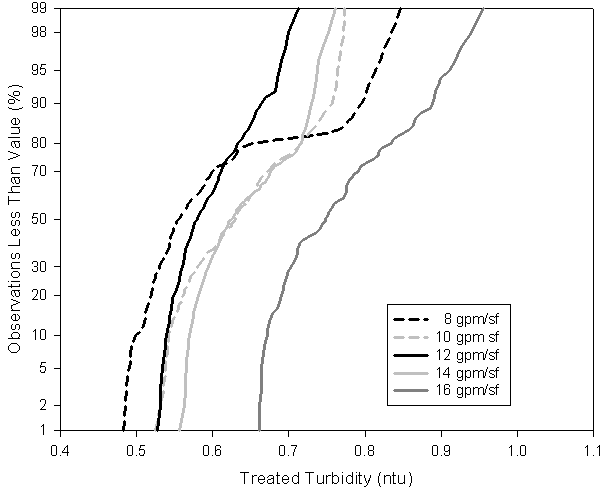
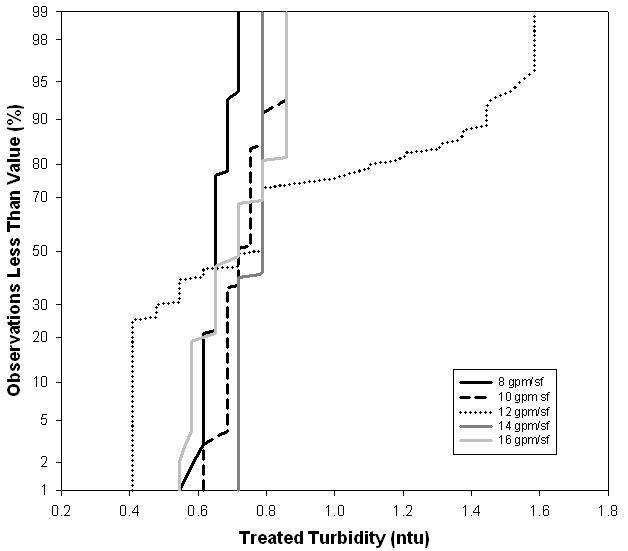
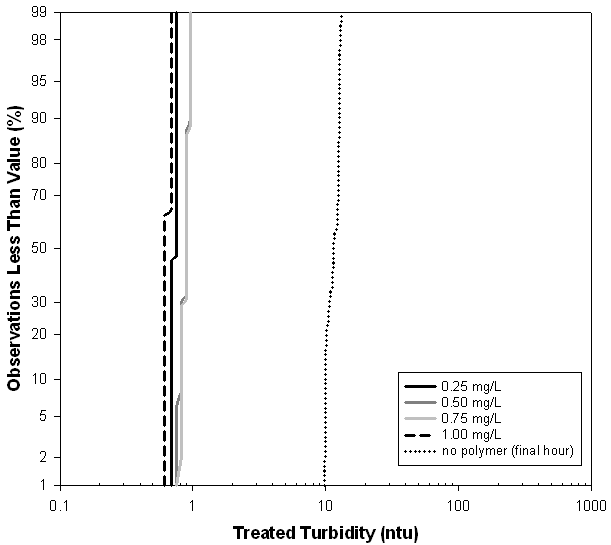
Pilot test results from September 2007 are summarized in Table B.6. Based on these results a 14 gpm/ft2 design loading rate and a 16-min flocculation time were used. Testing also demonstrated that a polymer is required to meet treated water goals of <2 ntu.
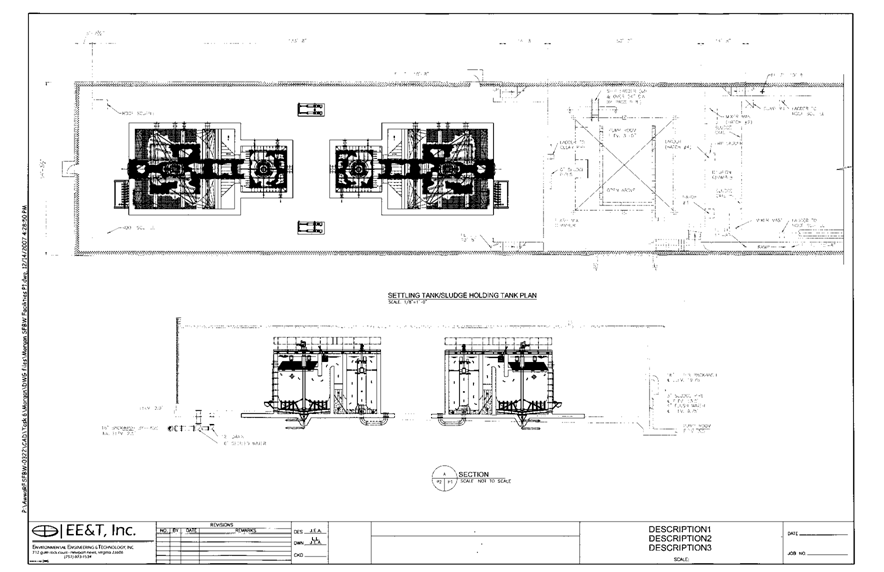
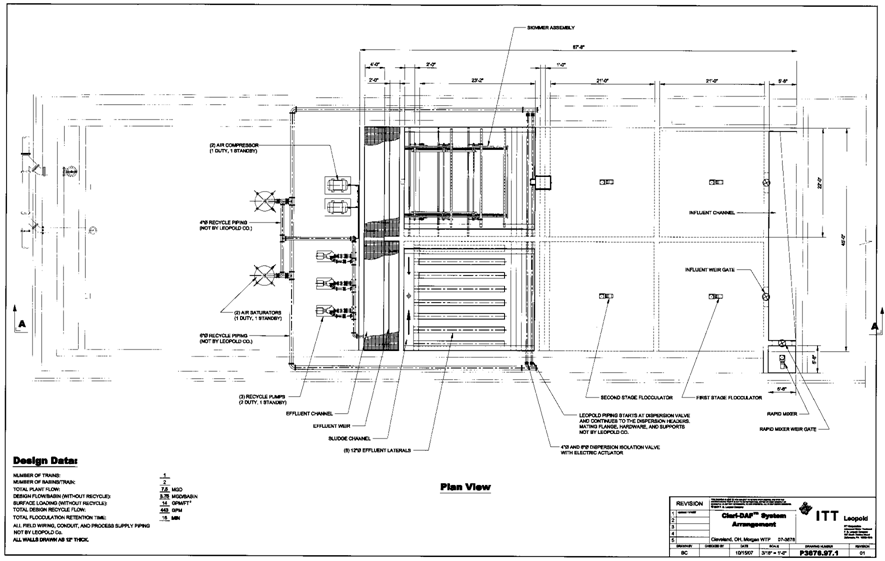
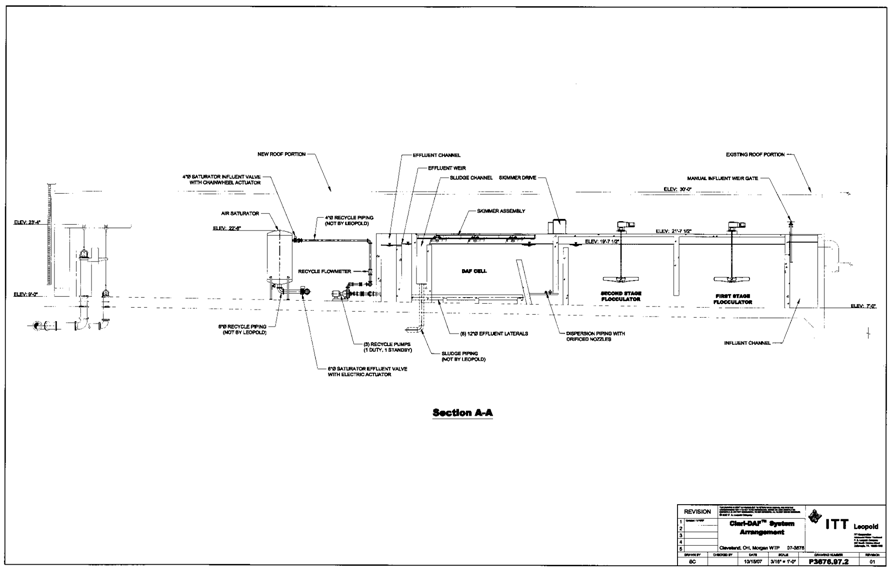
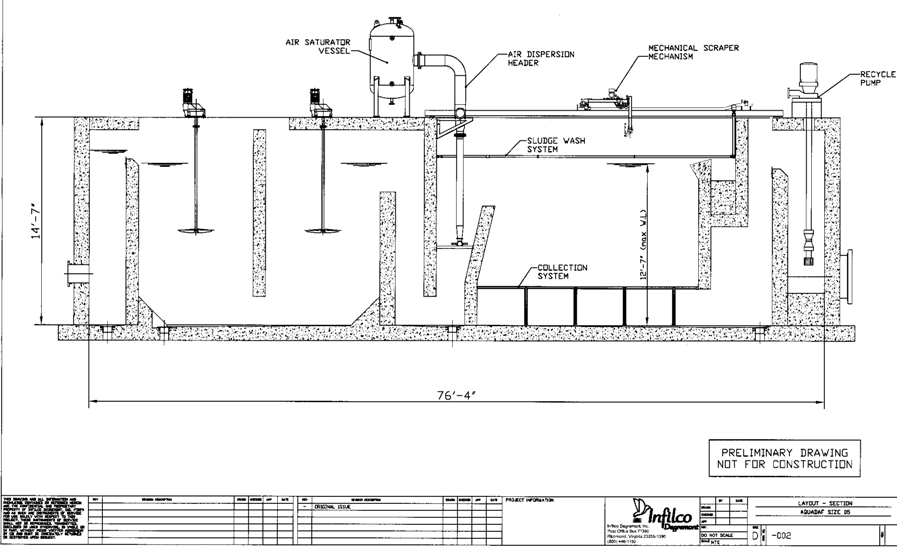
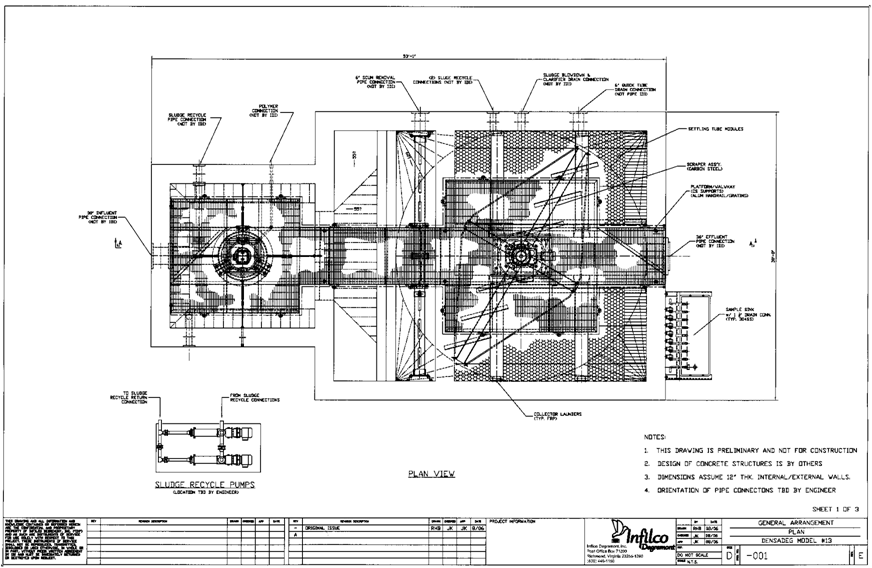
Option B would retrofit the existing 7,000-ft2 clarifier system with two 5,200-gpm ClariDAF systems to meet new SFBW production targets. The new system would have a total footprint of approximately 109 ft by 45 ft or 4,900 ft2 as depicted in Figures B.12 and B.13. The retrofit would involve renovation of the existing building to include raising the clarifier roof, reconstruction of basin walls, and adding necessary equipment. Cost calculations are summarized in Tables B.5 and B.6. Costs include construction of concrete roof, walls, ClariDAF equipment, instrumentation, controls, pumps, and a polymer feed system. Plan and profile drawings of the proposed system are depicted in Figures B.12 and B.13.
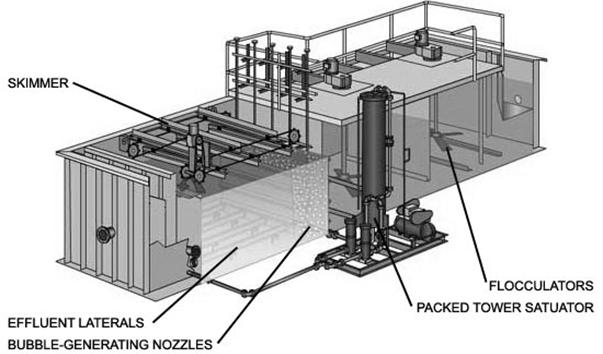
Provided by
Figure B.10 ClariDAF Schematic
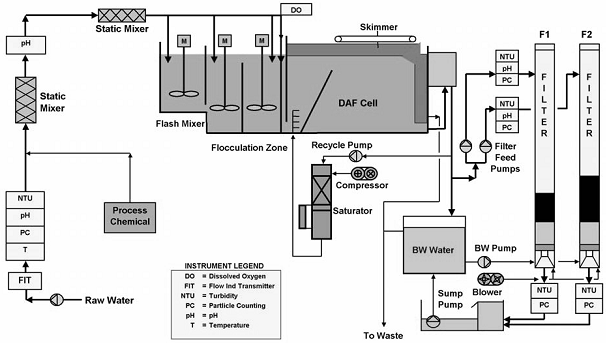
Provided by
Figure B.11 ClariDAF Pilot Schematic
Table B.6
Summary of Leopold pilot testing at
|
Duration
(hours) |
Rate (gpm/ft2) |
Recycle
(percent) |
Floc time (min) |
Polymer dose
(mg/L) |
Flash mix |
Turbidity
(ntu) |
Particles
>2 µm per mL |
||||||
|
Untreated |
Treated |
Treated |
|||||||||||
|
Median |
Median |
Mean |
95th
perc. |
Percent <2 ntu |
Count |
Avg |
|||||||
|
Impact of LT22s polymer dose |
|||||||||||||
|
2.75 |
8 |
11.9 |
16 |
0.0 |
no |
6.29 |
1.61 |
2.58 |
7.60 |
71.9 |
2 |
9,148 |
|
|
2.17 |
8 |
11.8 |
16 |
0.3 |
no |
3.67 |
0.50 |
1.33 |
3.98 |
74.3 |
1 |
1,297 |
|
|
Impact of flash mix |
|||||||||||||
|
2.17 |
8 |
11.8 |
16 |
0.3 |
no |
3.67 |
0.50 |
1.33 |
3.98 |
74.3 |
1 |
1,297 |
|
|
3.75 |
8 |
12.1 |
16 |
0.3 |
yes |
3.96 |
0.53 |
0.62 |
1.58 |
97.1 |
1 |
915 |
|
|
Impact of flocculation time |
|||||||||||||
|
2.17 |
8 |
12.4 |
0 |
0.3 |
yes |
3.57 |
0.65 |
0.63 |
0.66 |
100.0 |
1 |
2,439 |
|
|
2.58 |
8 |
12.3 |
8 |
0.3 |
yes |
4.95 |
0.50 |
0.50 |
0.56 |
100.0 |
1 |
926 |
|
|
3.75 |
8 |
12.1 |
16 |
0.3 |
yes |
3.96 |
0.53 |
0.62 |
1.58 |
97.1 |
1 |
915 |
|
|
3.83 |
8 |
12.3 |
27 |
0.3 |
yes |
4.70 |
0.35 |
0.57 |
1.43 |
100.0 |
2 |
805 |
|
|
Impact of clarification rate |
|||||||||||||
|
3.83 |
8 |
12.3 |
27 |
0.3 |
yes |
4.70 |
0.35 |
0.57 |
1.43 |
100.0 |
2 |
805 |
|
|
1.83 |
10 |
9.8 |
22 |
0.3 |
yes |
1.56 |
0.38 |
0.43 |
0.87 |
100.0 |
1 |
1,000 |
|
|
2.00 |
12 |
14.0 |
18 |
0.3 |
yes |
1.47 |
0.36 |
0.38 |
0.45 |
100.0 |
1 |
1,223 |
|
|
1.83 |
14 |
12.2 |
14 |
0.3 |
yes |
1.38 |
0.38 |
0.38 |
0.39 |
100.0 |
1 |
1,082 |
|
|
54.25 |
15 |
11.6 |
14 |
0.3 |
yes |
3.88 |
0.40 |
0.42 |
0.51 |
99.8 |
8 |
1,159 |
|
|
Impact of recycle |
|||||||||||||
|
1.75 |
15 |
4.3 |
14 |
0.3 |
yes |
2.71 |
0.58 |
0.80 |
1.94 |
95.6 |
1 |
1,581 |
|
|
1.42 |
15 |
6.8 |
14 |
0.3 |
yes |
3.15 |
0.61 |
0.62 |
0.67 |
100.0 |
1 |
1,652 |
|
|
54.25 |
15 |
11.6 |
14 |
0.3 |
yes |
3.88 |
0.40 |
0.42 |
0.51 |
99.8 |
8 |
1,159 |
|
Table B.7
10 percent SFBW recycle EQ and ClariDAF Retrofit cost
analysis
|
Item |
Capital cost ($) |
O&M cost ($/yr) |
20-yr present worth ($) |
|
New EQ basin (44-ft diameter) |
2,453,000 |
43,000 |
2,944,000 |
|
ClariDAF system retrofit |
8,900,000 |
178,000 |
11,000,000 |
|
TOTAL PROJECT |
11,353,000 |
221,000 |
13,944,000 |
Table B.8
5 percent SFBW recycle EQ and ClariDAF Retrofit cost
analysis
|
Item |
Capital cost ($) |
O&M cost ($/yr) |
20-yr present worth ($) |
|
New EQ basin (93-ft diameter) |
4,740,000 |
75,000 |
5,604,000 |
|
ClariDAF system retrofit |
8,900,000 |
178,000 |
11,000,000 |
|
TOTAL PROJECT |
13,640,000 |
253,000 |
16,604,000 |
 Provided by
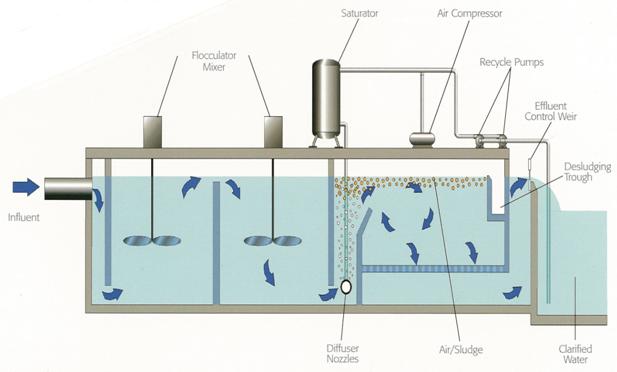
 Provided by Infilco-Degremont, September
2007
Provided by Infilco-Degremont, September
2007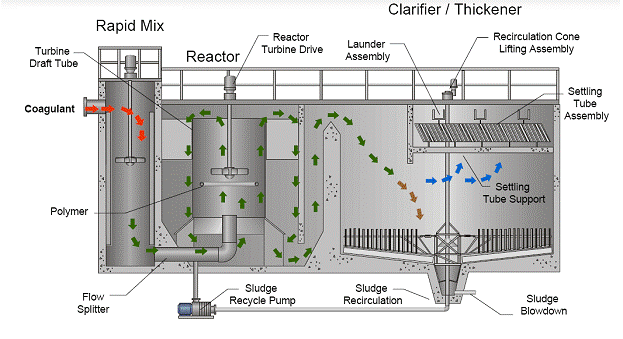
 Provided by Infilco-Degremont, September
2007
Provided by Infilco-Degremont, September
2007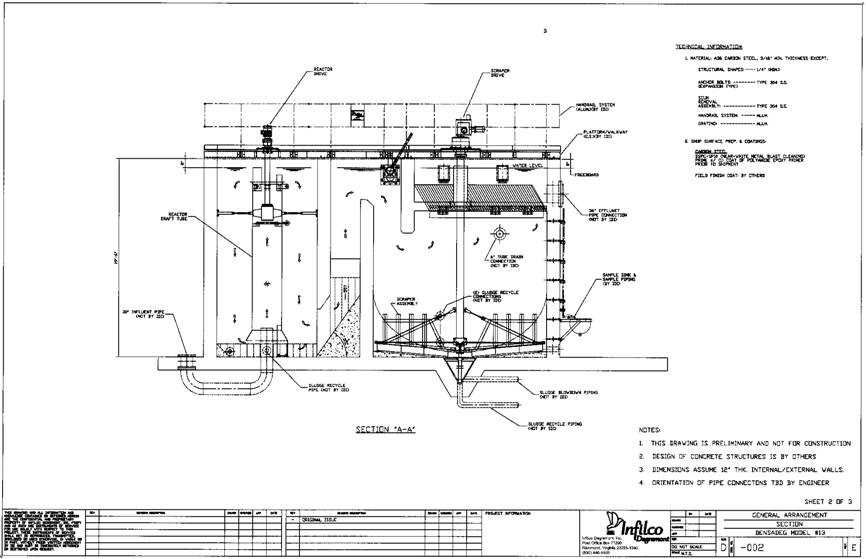 Provided by Infilco-Degremont, September
2007
Provided by Infilco-Degremont, September
2007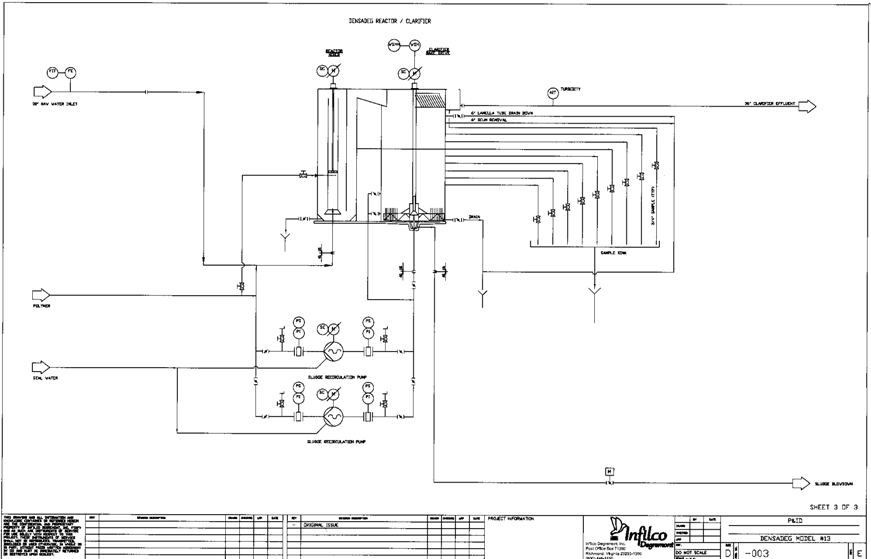 Provided by Infilco-Degremont, September
2007
Provided by Infilco-Degremont, September
2007